Features
Analytics
Measure and analyze engineering performance metrics across the team
We’re hiring! Join our team as a Founding AI Engineer 🚀
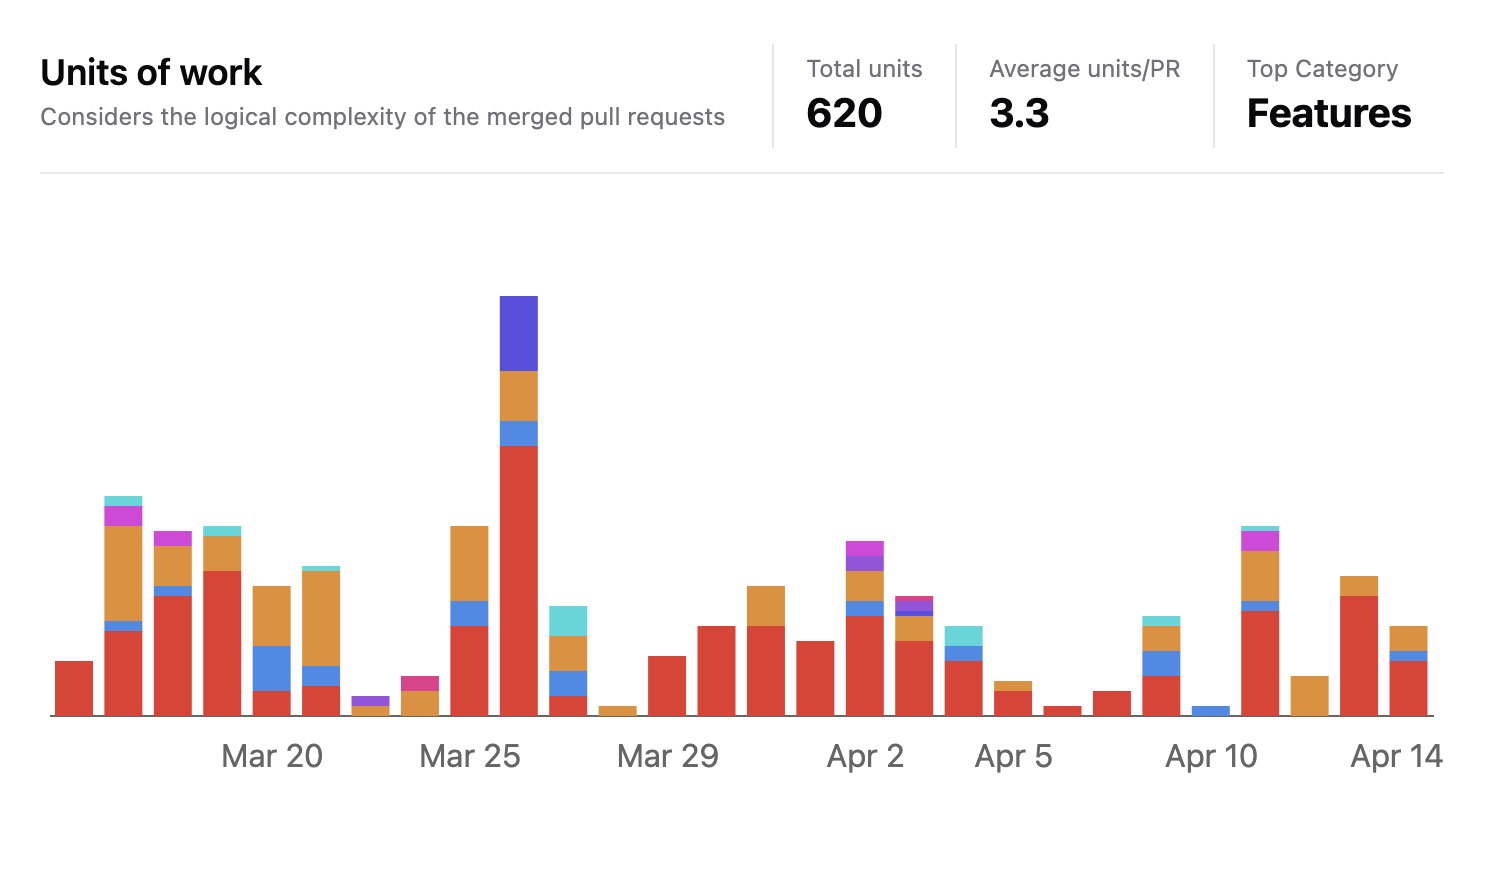
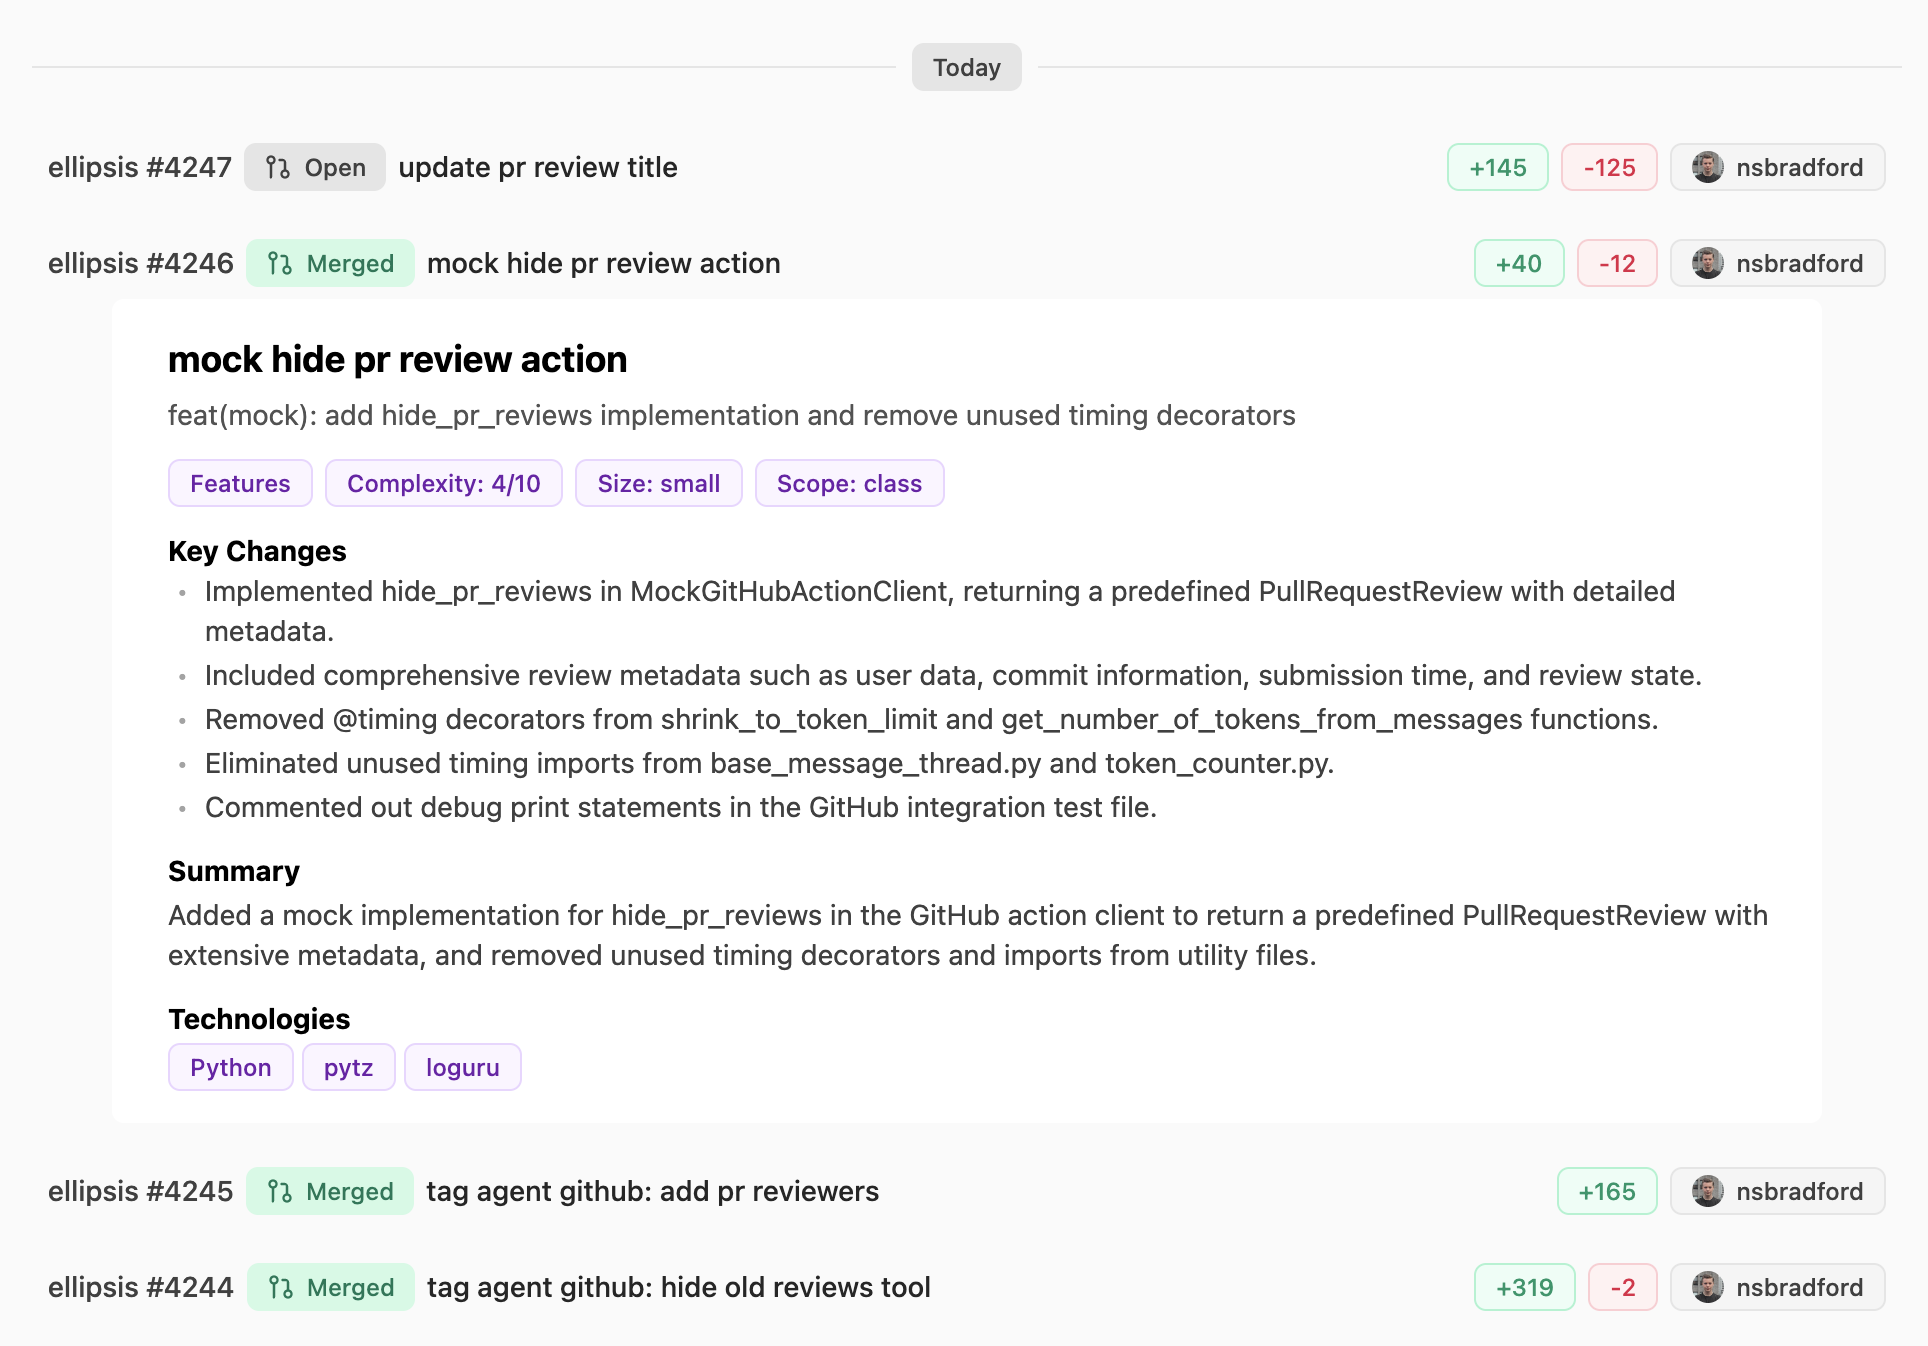
Units of Work
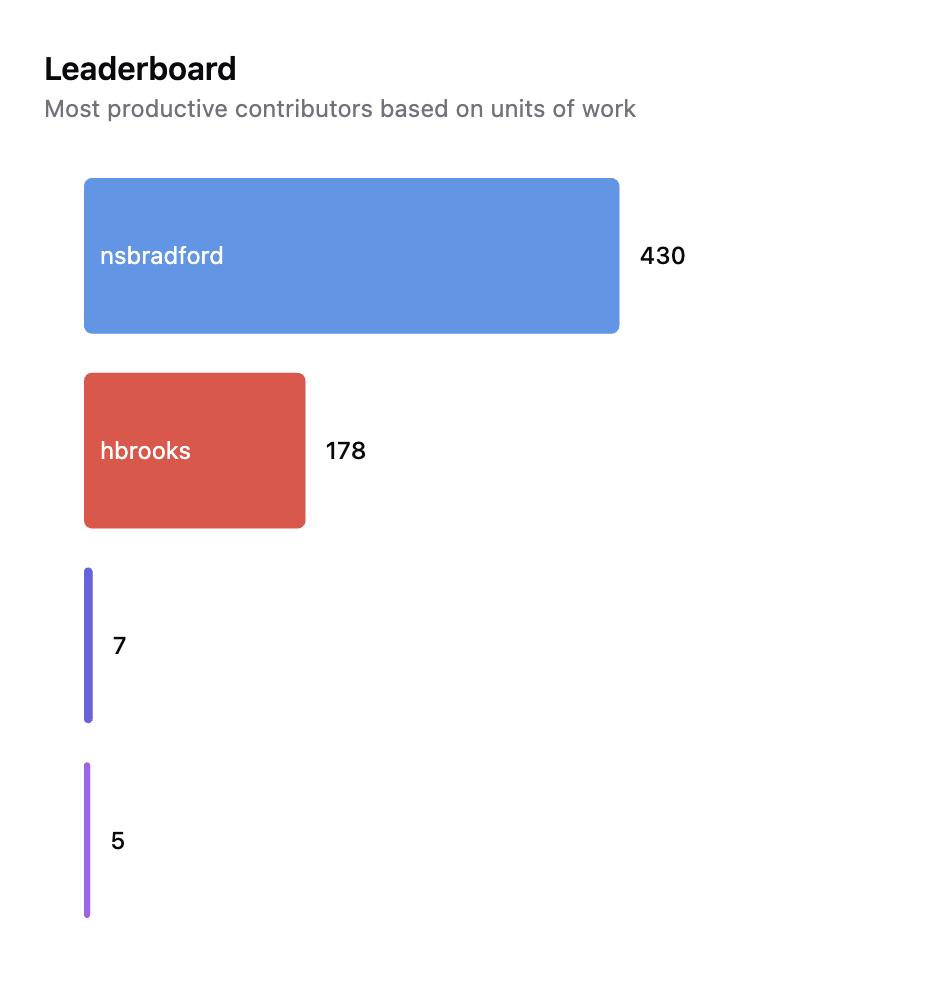
Leaderboard
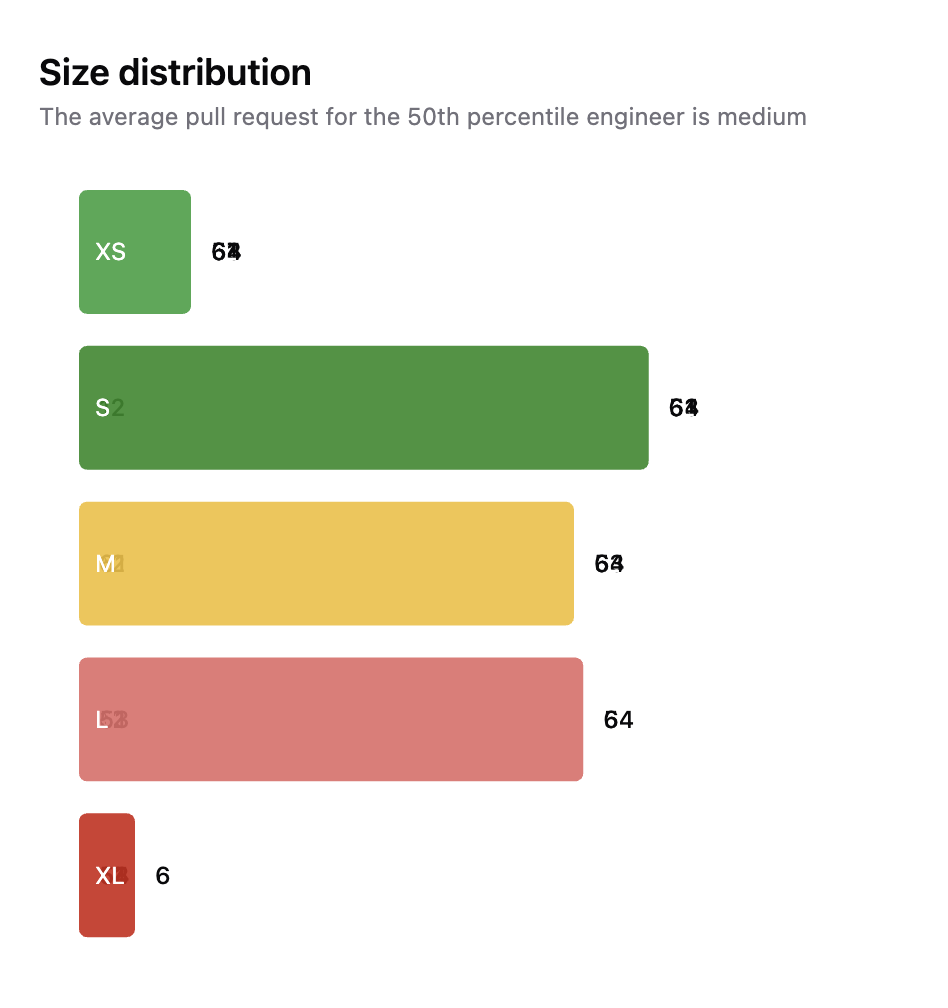
Size Distribution
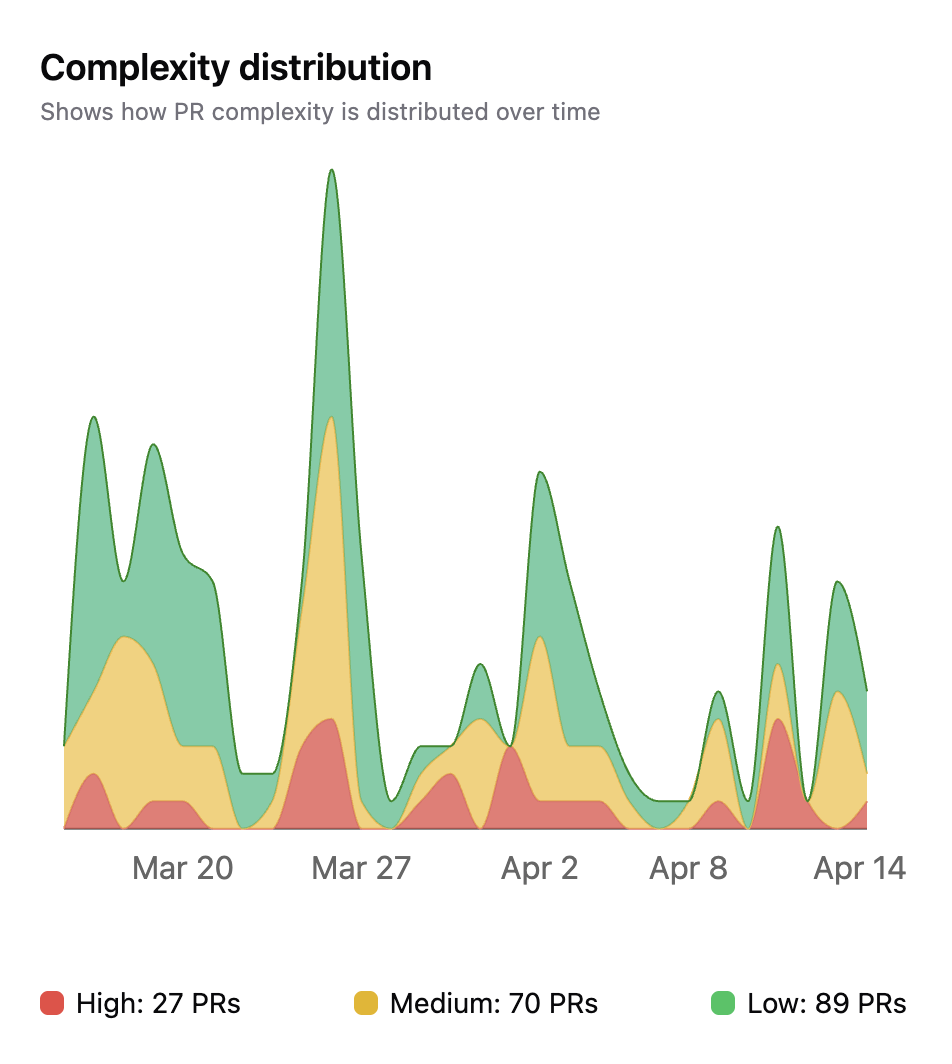
Complexity Distribution
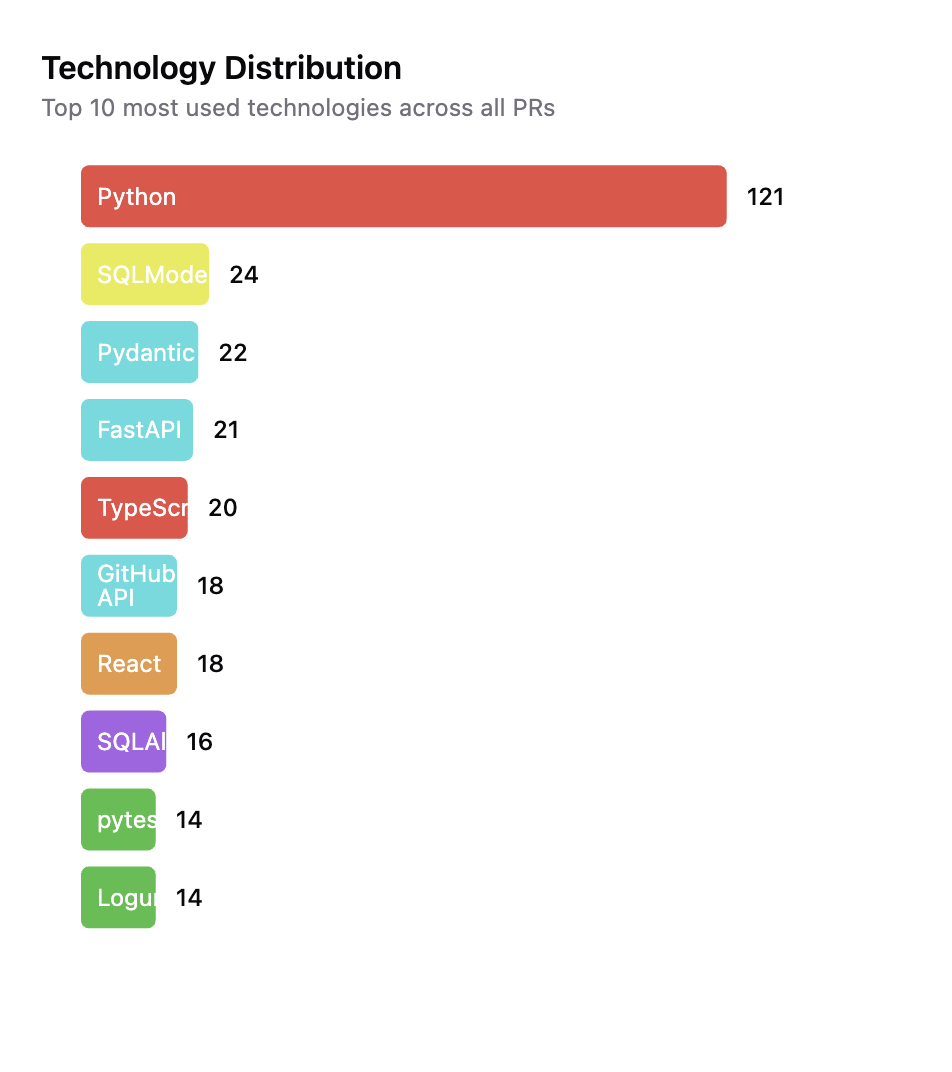
Technology Usage
Timeline
Querying Metrics with the Slackbot
You can easily access these metrics by asking questions directly to the Ellipsis Slackbot. Simply tag @ellipsis in a channel or send a direct message to get instant answers. Example questions you can ask:- “@Ellipsis what was our average PR review time last month?”
- “@Ellipsis which repositories had the most bug fixes this quarter?”
- “@Ellipsis how has our deployment frequency changed over the past 6 months?”
- “@Ellipsis who are our top contributors to the backend services?”
- “@Ellipsis generate a report of our engineering metrics for Q1”
- “@Ellipsis compare our code churn rate between Q1 and Q2”
- “@Ellipsis which PRs took longest to review in the last sprint?”
- “@Ellipsis what’s the trend in our documentation coverage?”
- “@Ellipsis who reviews the most PRs on our team?”
- “@Ellipsis which part of our codebase changes most frequently?”
- “@Ellipsis create a velocity report for the auth service team”
- “@Ellipsis what was our average time to fix critical bugs this year?”
Start a free trial
Click here to start a free 7 day trial of AI Code Reviews & Bug Fixes